In the first part, I talked about what Data Quality, Anomaly Detection and Outliers Detection are and what’s the difference between outliers detection and novelty detection. In this part, I will talk about a very known and easy method to detect outliers called Interquartile Range.
Introduction
The Interquartile Range method, also known as IQR, was developed by John Widler Turky, an American mathematician best known for development of the FFT algorithm and box plot.
IQR is a measure of statistical dispersion, which is equal to the difference between the 75th percentile and the 25th percentile. In other words:
$$IQR = Q3 - Q1$$
How Interquartile Range works
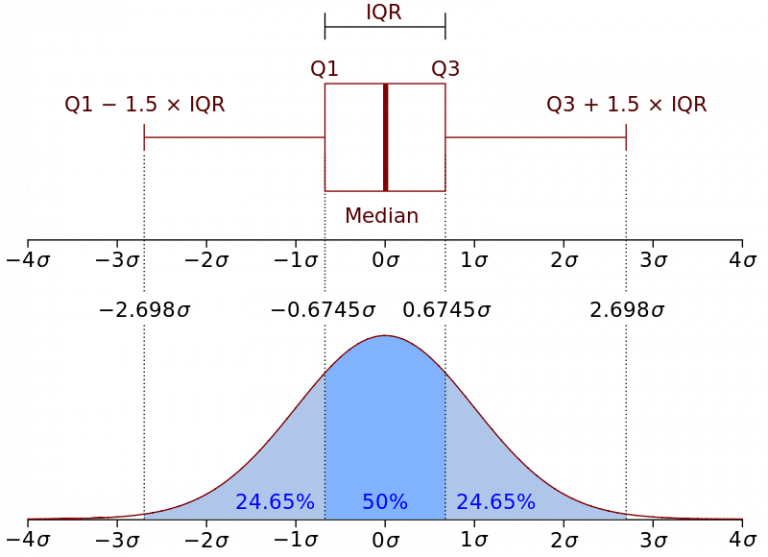
Representation of the Interquartile Range - Wikipedia
IQR is a fairly interpretable method, often used to draw Box Plots and display the distribution of a dataset.
IQR Can also be used to detect outliers in a few easy and straightforward steps:
- Calculate the 1st quartile $Q1$.
- Calculate the 3rd quartile $Q3$.
- Calculate $IQR = Q3 - Q1$.
- Calculate the bounds:
- Lower bound: $Q1 - 1.5 * IQR$
- Upper bound: $Q3 + 1.5 * IQR$
- Flag any points outside the bounds as suspected outliers.
If you’re wondering why John chose $1.5 * IQR$ and not some other value, it can be explained in the Wikipedia picture and also this post.
If we look at the picture, we can see that the lower bound and the upper bound correspond, respectively, to $-2.698\sigma$ and $2.698\sigma$.
This reminds me of the 68-95-99.7 rule, which says that about 99.7% of points are within $3\sigma$ and that the rest can be considered as outliers.
PySpark Implementation
This PySpark implementation can work on any Dataframe and all of its columns. The Dataframe should have a unique column used to identify outliers.
Imports
import pyspark.sql.functions as f
Calculating the bounds
Firstly, we calculate the lower and upper bounds for each column:
def calculate_bounds(df):
  bounds = {
        c: dict(
            zip(["q1", "q3"], df.approxQuantile(c, [0.25, 0.75], 0))
        )
        for c,d in zip(df.columns, df.dtypes) if d[1] == "int"
    }

    for c in bounds:
        iqr = bounds[c]['q3'] - bounds[c]['q1']
        bounds[c]['min'] = bounds[c]['q1'] - (iqr * 1.5)
        bounds[c]['max'] = bounds[c]['q3'] + (iqr * 1.5)

    return bounds
Flagging outliers
Then we flag outliers based on the calculated bounds. For each column, we create a new column named columnName_outlier that contains yes or no.
def flag_outliers(df, id_col):
  bounds = calculate_bounds(df)
  outliers = {}

  return df.select(c, id_col,
        *[
            f.when(
                ~f.col(c).between(bounds[c]['min'], bounds[c]['max']),
                "yes"
            ).otherwise("no").alias(c+'_outlier')
        ]
    )
Conclusion
To sum up, IQR or Interquartile Range is a very interpretable method to detect outliers. In this blog post, I explained how the method works and showed how we can easily implement it in PySpark.