In parts #1 and #2 of the “Outliers Detection in PySpark” series, I talked about Anomaly Detection, Outliers Detection and the interquartile range (boxplot) method. In this third and last part, I will talk about how one can use the popular K-means clustering algorithm to detect outliers.
K-means
K-means is one of the easiest and most popular unsupervised algorithms in Machine Learning for Clustering. It aims to cluster data points into different K clusters in an iterative process.
Most importantly, the algorithm is parametric. It needs K, the number of clusters and, sometimes, the maximum number of iterations so that it doesn’t run forever.
How it works
- Generate K random centroids.
- Associate each data point to the nearest centroid.
- Re-generate the K centroids.
- Repeat steps 2 and 3 until nothing changes (or other conditions, since it doesn’t guarantee an optimal solution).
K-means Illustration - Introduction to Clustering (David Runyan)
Using K-means to detect outliers
Although it’s not the best of solutions, K-means can actually be used to detect outliers. The idea is very simple: After constructing the clusters, we flag points that are far as outliers. In other words, we consider points that are far from the centroid of the cluster they belong to (distance-wise) as outliers.
Above all, this technique is also parametric and expects you to provide the fraction of outliers the data contains, which isn’t always possible.
Here are the steps:
- Run the K-means on all the data points.
- For each point:
- Predict the cluster they belong to.
- Calculate the distance between the point and the centroid of that cluster.
- Based on a given fraction, flag outliers.
Illustration
The following images are generated using this website.
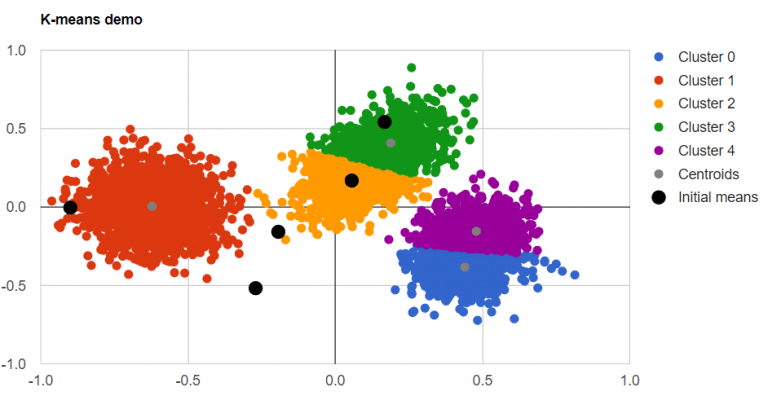
Outliers detection - Illustration #1
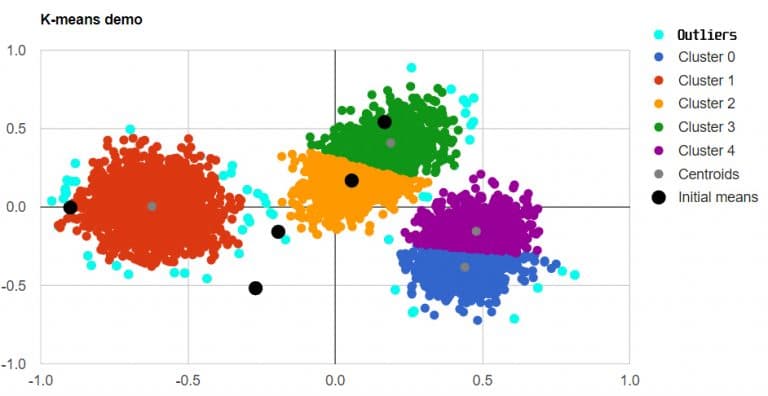
Outliers detection - Illustration #2
PySpark Implementation
Firstly, we’ll run K-means on all the data points and predict the clusters they belong to:
from pyspark.mllib.clustering import KMeans

k = 10 # Try different numbers
maxIterations = 100 # Try different numbers
data_rdd = ... # An RDD containing all the data
training_rdd = ... # An RDD containing, for each row, a tuple with all the values (except the row key)
model = KMeans.train(training_rdd, k, maxIterations=maxIterations)
preds = model.predict(training_rdd)
Secondly, calculate the distance between each point and the centroid of the cluster it belongs to:
def to_distances(entry):
  data_point = entry[0]
  prediction = entry[1]
  centroid = model.centers[prediction]
  return np.linalg.norm(data_point - centroid)

# Calculate the distances
distances = training_rdd.zip(preds).map(to_distances)
# Zip each row with its key so that they can be identified later on
distances_and_keys = distances.zip(data_rdd).map(lambda (distance, data_tuple): (data_tuple[key_col], distance))
Lastly, calculate the number of outliers based on the given fraction and flag outliers:
number_of_outliers = int(outliers_fraction * distances.count())
outliers = distances_and_keys.sortBy(lambda (key, distance): distance, ascending=False).take(number_of_outliers)
To sum up, data quality is an important side of data mining overall. I focused on Anomaly detection (Outliers detection specifically) because that’s what I was working on these months and I saw how important it was in real use cases, such as banking systems.
In these posts I introduced what these terms meant and explain 2 easy and popular algorithms: Interquartile Range and K-means clustering.
Hope you enjoyed the series!